Data Analysis
Variables:
Pearson's r
Allows us to know the strength and direction of linear association between two scale variables.
Scatter Plot
We have generated a scatter plot with best fit line based on the data with had collected using SPSS.
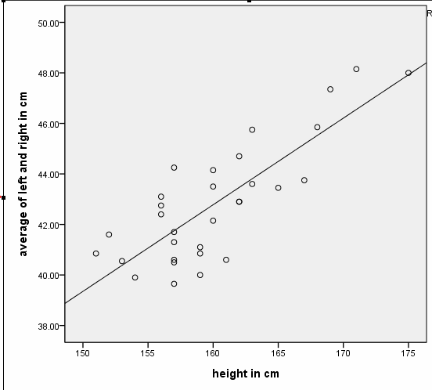
- Height of a person (Scale Data)
- Length of elbow to tip of hand of a person (Scale Data)
Statistical Method
Since both the variables are scale data, we have decided to use the Pearson's r method to compute our results.Pearson's r
Allows us to know the strength and direction of linear association between two scale variables.
Scatter Plot
We have generated a scatter plot with best fit line based on the data with had collected using SPSS.
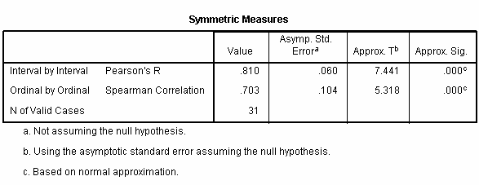
We have also generated the Peason's r coefficient using SPSS.
There is a positive, very strong, and significant asociation between a person's height and 4 times the length of elbow to tip of hand. (r=0.810, p<0.05, N=31).
Limitations
Limitations
posted by statistics at
21:24
![]()

0 Comments:
Post a Comment
Subscribe to Post Comments [Atom]
<< Home